Featured Client Result
Real Shopify store growth and order activity
A closer look at real Shopify store growth and order activity.
Permission-approved Shopify dashboards, selected work and client experiences. Open any proof to inspect it clearly.
Watch the original Shopify dashboard recording with its authentic performance and order activity visible in context.
A closer look at real Shopify store growth and order activity.
Uploaded client proof and existing results, kept at their original proportions for clear inspection.
Shopify sales, orders and conversion activity across a 30-day period.
A client Shopify dashboard showing sales and order activity for the selected 30-day period.
A client Shopify dashboard showing sales, orders and conversion activity for the selected week.
A client Shopify dashboard showing sales, orders and conversion activity for the selected day.
One day
The store's reporting dashboard shows $8,433.19 in sales for the selected single day.
Client project details available upon request.
One day
This screenshot shows $10,116.48 in reported sales and the order volume recorded for that day.
Client project details available upon request.
Seven days
The store's reporting dashboard shows $18.37K in sales across the selected seven-day period.
Client project details available upon request.
Thirty days
This screenshot shows $39,936 in reported store revenue during the selected thirty-day period.
Client project details available upon request.
Thirty days
The dashboard records $51.29K in sales over the selected thirty-day reporting period.
Client project details available upon request.
Two months
This sales dashboard shows $13,313.71 in reported revenue across the selected two-month period.
Client project details available upon request.
One day
The dashboard records $12,732.88 in sales for the selected single day.
Client project details available upon request.
One day
This screenshot shows $10,427.50 in reported sales and the orders recorded for that day.
Client project details available upon request.
One day
The dashboard records $110,257.80 in reported revenue for the selected single day.
Client project details available upon request.
Verified results slide 1 of 13
Real client results shared with permission. Individual outcomes vary depending on the store, offer, traffic and strategy.
Figures shown are taken from client-provided or platform-reported dashboards. Sales performance can be influenced by multiple factors, including the product, traffic, pricing, advertising and market conditions.
Explore selected e-commerce websites and the customer experience thinking behind them.

Live red light therapy store selling recovery, skincare and sleep devices.
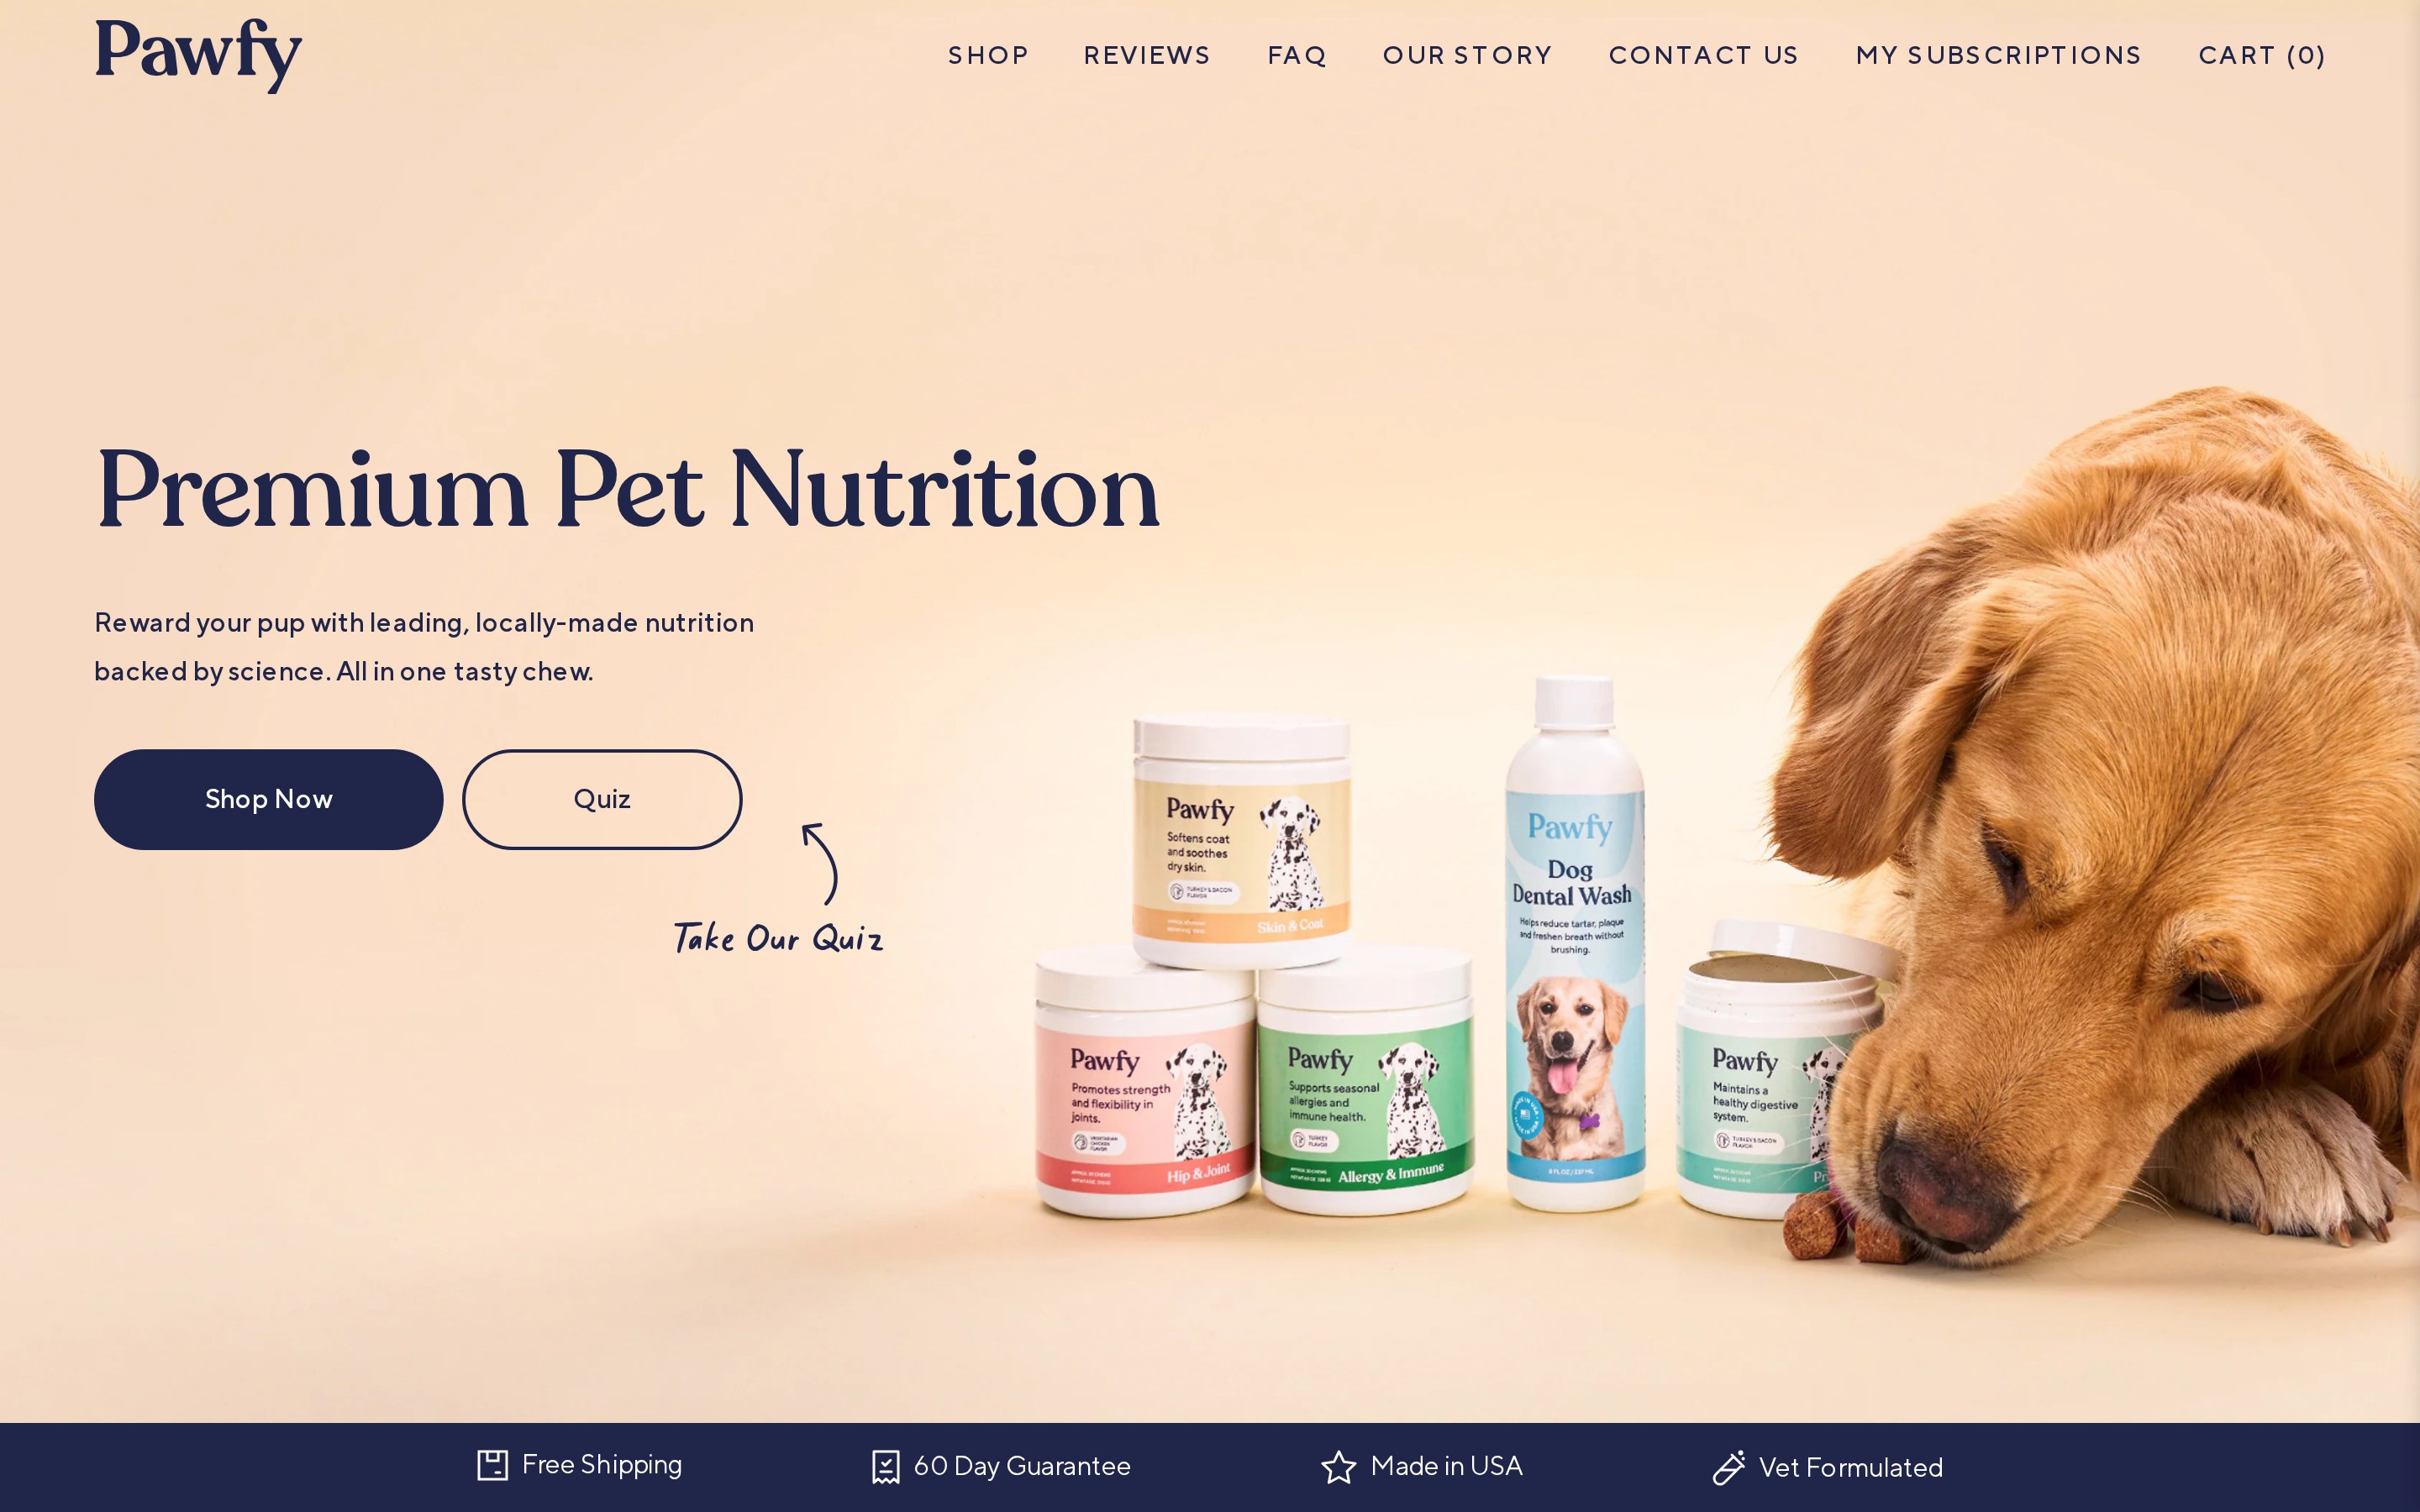
Live pet nutrition store selling dog supplements and daily care products.
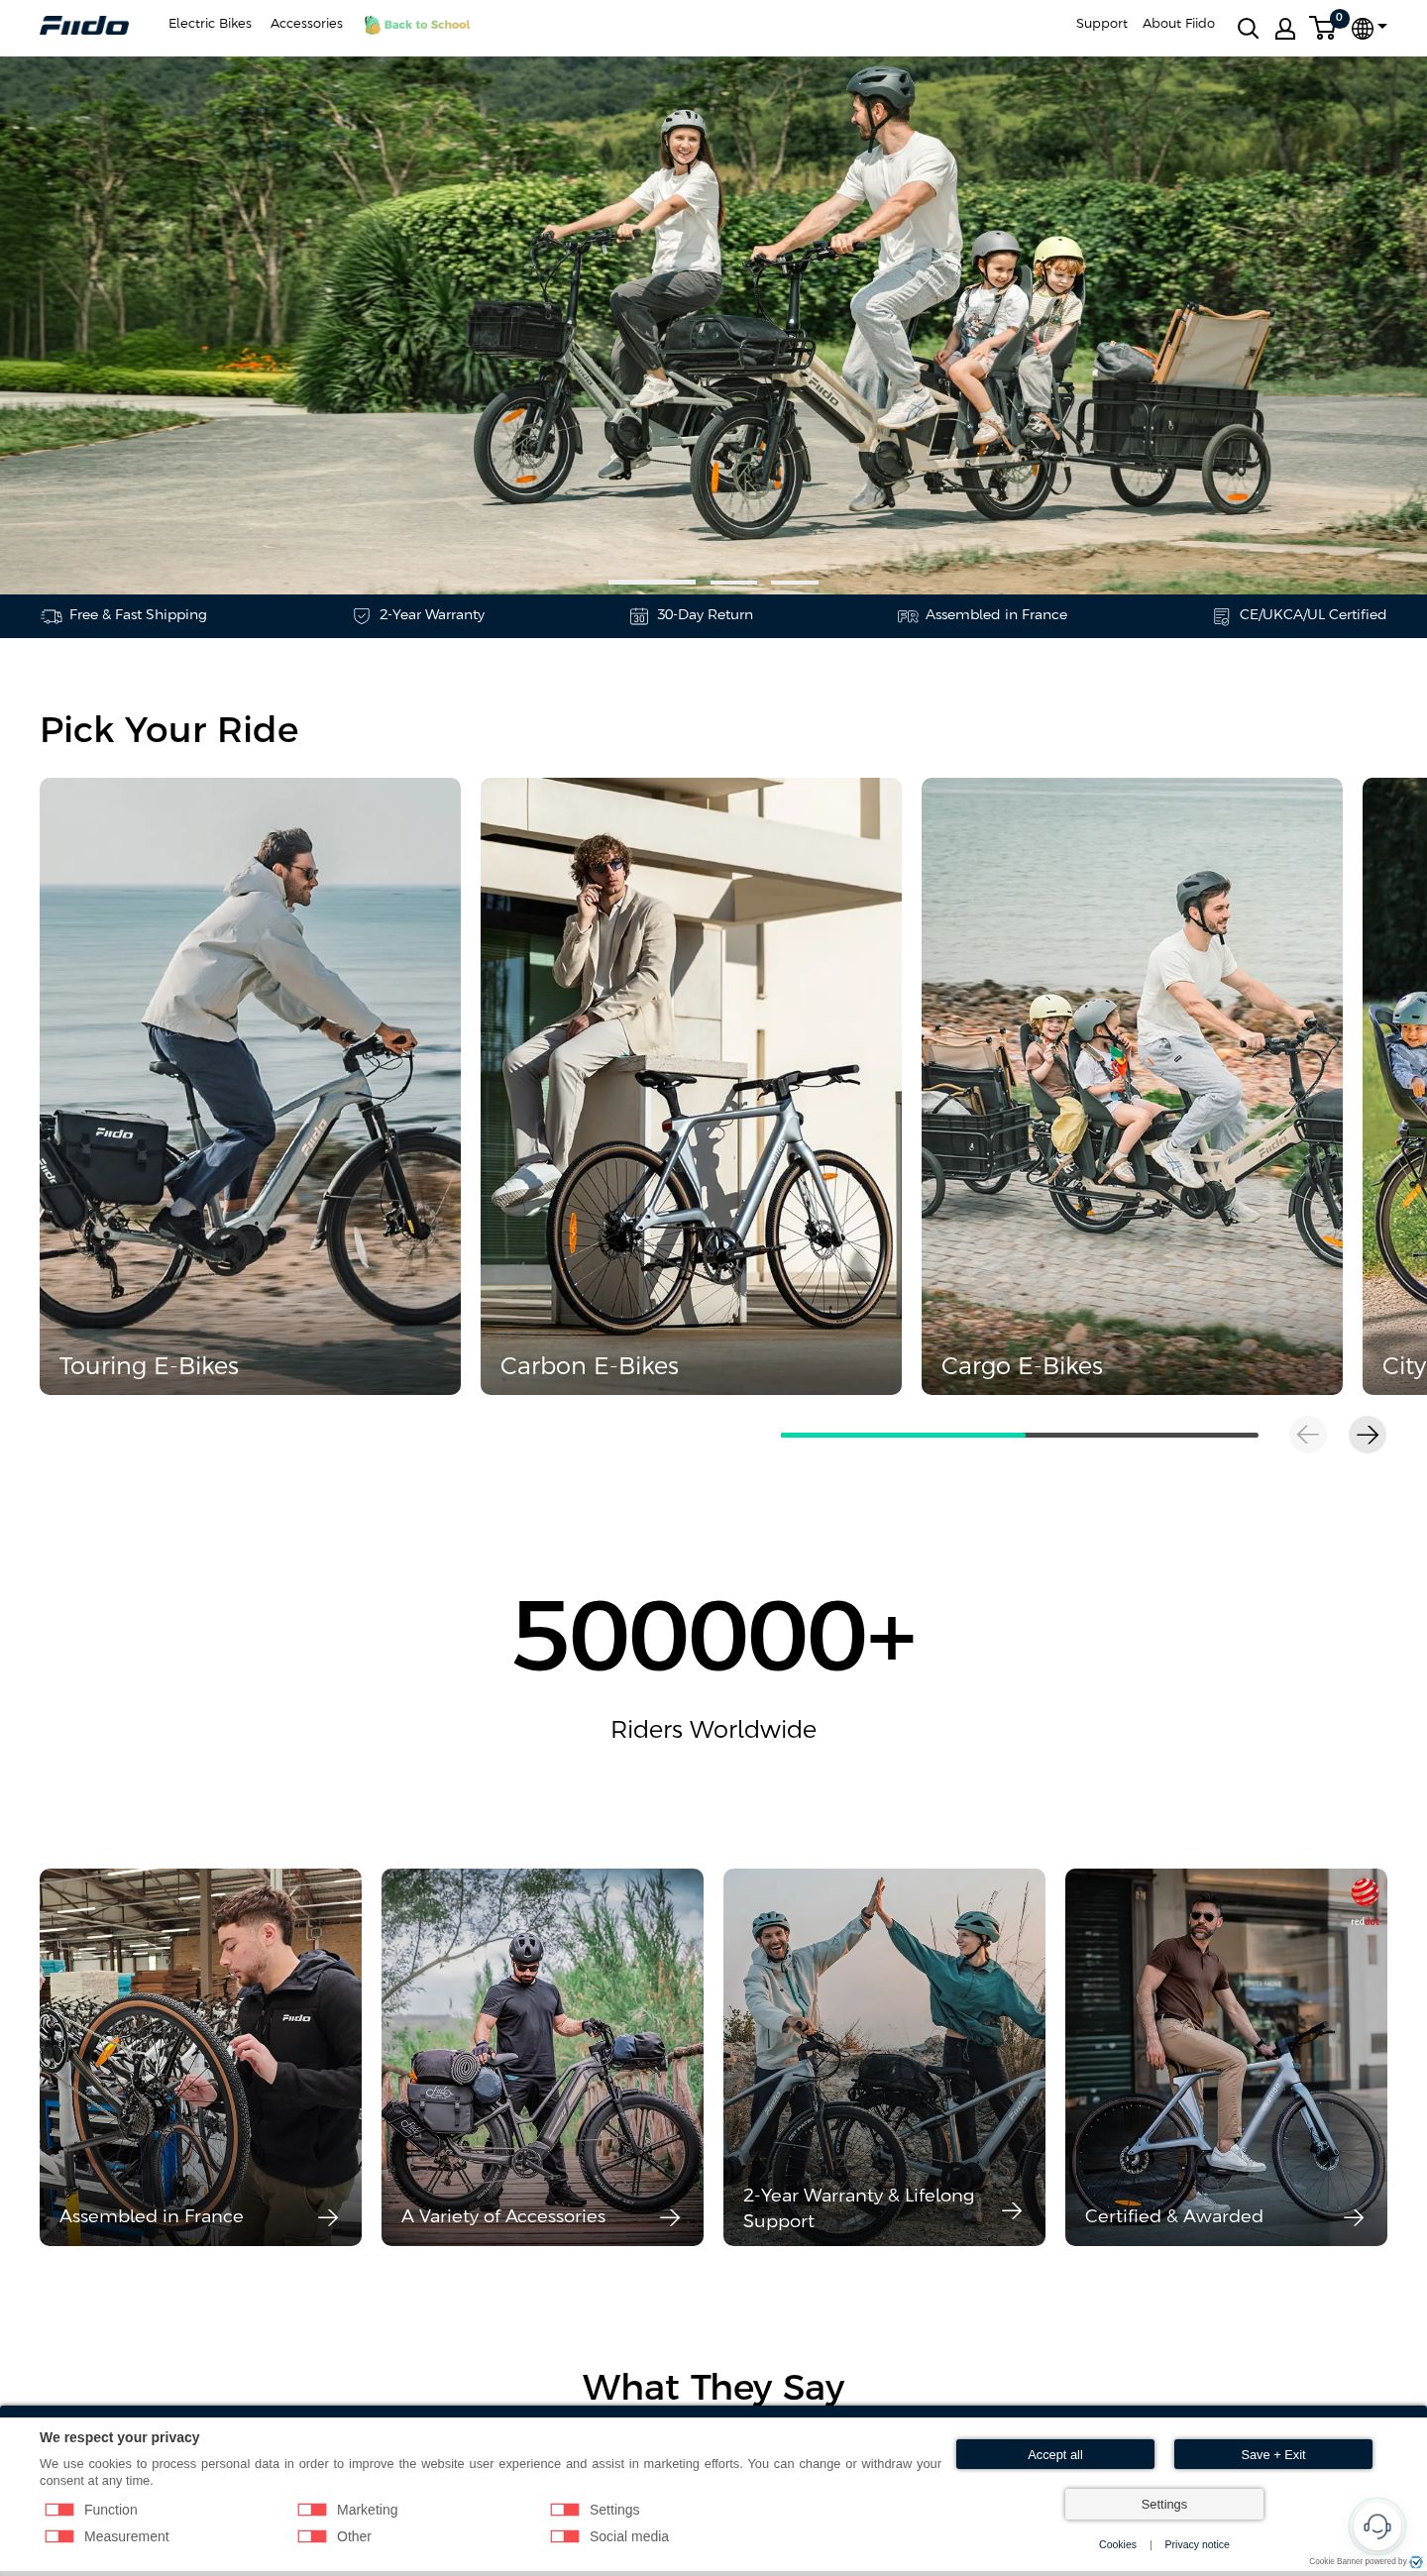
Live electric bike store selling commuter, folding and cargo models.
It might need a better customer journey. Let's identify what's holding your store back and find the highest-impact opportunities to improve it.